Tips
Binning interval
Binning interval is used for processing of data except for raw operator. Basically, the interval is determined by width of panel and time range.
For example if width of panel is 300 px and time range is 1 hour (= 3600 seconds) then interval is 12 seconds.
Auto raw operation
When a binning interval is less than 1 second, raw data is retrieved even if other operator is set. To disable auto raw operation, disableAutoRaw function is available.
Extrapolation for raw operation
In raw operator mode, the retrieved data is extrapolated by last data value. This feature prevents a graph from cutting of or not being desplayed. To disable the extrapolation, disableExtrapol function is available.
Array data support
The plugin supports array data from version 1.2.0.
Array data is managed like a table in the plugin. Following is a example of array data that has 3 elements:
time |
PV:NAME[0] |
PV:NAME[1] |
PV:NAME[2] |
|---|---|---|---|
2020-01-02 03:04:00 |
1 |
2 |
3 |
2020-01-02 03:05:00 |
4 |
5 |
6 |
2020-01-02 03:06:00 |
7 |
8 |
9 |
The data has a column for time and columns for each array elements. Column name for a array element is set as PV name with suffix for an index.
This table format called wide format data frame is available from most of Grafana panel.
The plugin also supports conversion from array data to scalar data with the Array to Scalar functions. Above array data becomes as following with toScalarByMin:
time |
PV:NAME (min) |
|---|---|
2020-01-02 03:04:00 |
1 |
2020-01-02 03:05:00 |
4 |
2020-01-02 03:06:00 |
7 |
You can use as many Array to Scalar functions as you need for same array data.
The other functions except Options are not supported for array data.
Array format
From version 1.4.0, the plugin supports arrayFormat function to change the table format for array data.
There are 3 types of format: timeseries, index, and dt-space. timeseries format is default format described above.
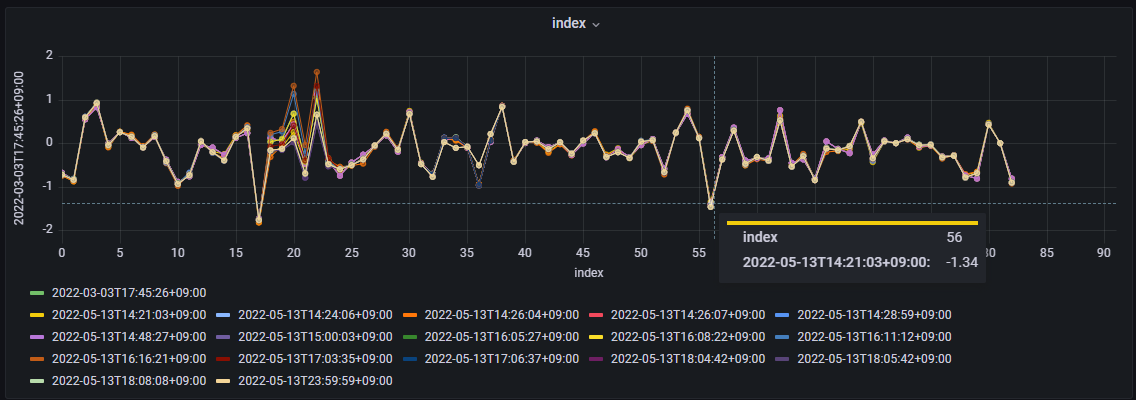
index format has a index column and columns for array data at each sampling time.
Column name for each sampling time is a RFC3339-style time format.
index |
2020-01-01T00:00:10.000Z |
2020-01-01T00:01:50.000Z |
|---|---|---|
0 |
val1_1 |
val2_1 |
1 |
val1_2 |
val2_2 |
… |
… |
… |
360 |
val1_361 |
val2_361 |
Time series panel can’t show a plot with this format, but XY chart panel can show the data with the x-axis as index:
dt-space format transforms multiple datapoints into a single timeseries data.
It creates a new time vector starting from the sampling time. Timestamp of Nth elements of the array is reproduced with (sampling time + N milliseconds).
time |
PV:NAME |
|---|---|
1577804410000 |
val1_1 |
1577804410001 |
val1_2 |
… |
… |
1577804410360 |
val1_361 |
1577804510000 |
val2_1 |
1577804510001 |
val2_2 |
… |
… |
1577804510360 |
val2_361 |
See Waveform visualization · Issue #83 · sasaki77/archiverappliance-datasource for details and hitory.